



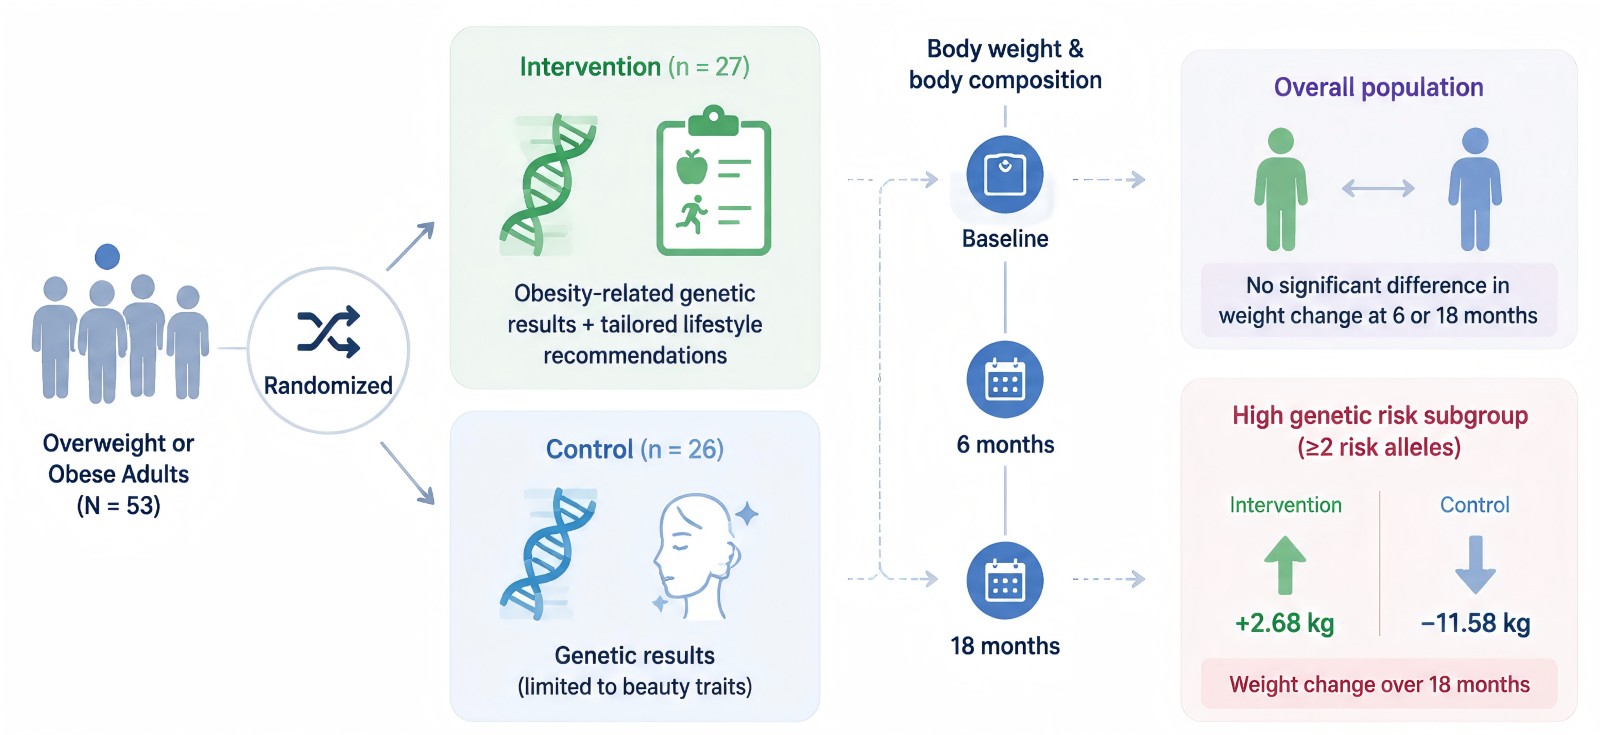
Can Genetic Risk Disclosure Drive Real Weight Loss? Insights from an 18-Month Randomized Controlled Trial
September 16, 2026

September 16, 2026
Obesity is a major public health challenge worldwide, defined as a body mass index (BMI) of thirty kilograms per square meter or higher. In Mexico, the public health crisis is acute, with the country ranking second among Organization for Economic Co-operation and Development (OECD) nations in adult obesity prevalence. National data from the National Health and Nutrition Survey (ENSANUT) indicate that over seventy-five percent of Mexican adults live with overweight or obesity, driven by rapid dietary shifts toward processed foods, socioeconomic factors, and strong genetic susceptibility with heritability reaching up to seventy percent.
While genome-wide association studies (GWAS) have identified numerous single nucleotide variants (SNVs) linked to metabolic traits in European and Asian populations, data regarding genetically admixed groups remain limited. Published in Frontiers in Genetics in 2026, this descriptive cross-sectional population genetic study addresses this gap. By evaluating an urban cohort from Mexico City, researchers established baseline frequency data for six key metabolic variants within the FTO, ANKK1/DRD2, MC4R, FABP2, ADRB2, and SH2B1 genes.
The study analyzed a cohort of one hundred twenty-nine unrelated Mexican adults in Mexico City, comprising fifty-nine females and seventy males aged eighteen to eighty-seven years. The selected genetic loci and their molecular characteristics are summarized in Tab.1.
Tab.1 Overview of selected genetic variants associated with obesity and metabolic traits. (Perezcano, et al., 2026)
| Gene | rsID | Nucleotide Change | HGVS c.Nomenclature | HGVS p. Nomenclature |
|---|---|---|---|---|
| FTO | rs9939609 | T>A | - | - |
| ANKK1/DRD2 | rs1800497 | C>T | c.2137G>A | p.Glu713Lys |
| MC4R | rs17782313 | T>C | - | - |
| FABP2 | rs1799883 | A>G | c.163A>G | p.Thr55Ala (Ala54Thr, legacy numbering) |
| ADRB2 | rs1042714 | G>C | c.79G>C | p.Glu27Gln |
| SH2B1 | rs4788102 | G>A | - | - |
Genotypic and allelic distributions across the six single nucleotide variants revealed substantial variability in minor allele frequencies (MAF), ranging from a high of 0.41 down to 0.12. As presented in Tab.2, all six variants successfully conformed to Hardy-Weinberg equilibrium expectations (p > 0.05 by exact test), confirming the absence of severe genotyping error or non-random mating within the cohort.
Tab.2 Distribution of genotypes for six obesity-associated genetic variants in the study population. (Perezcano, et al., 2026)
| Allelic frequencies | |||||||
|---|---|---|---|---|---|---|---|
| n | freq | n | freq | n | freq | ||
| FTO | T>A | T/T | 0.48 | T/A | 0.43 | A/A | 0.09 |
| rs9939609 | 62 | 55 | 12 | ||||
| ANKK1/DRD2 | C>T | C/C | 0.47 | C/T | 0.42 | T/T | 0.11 |
| rs1800497 | 61 | 54 | 14 | ||||
| MC4R | T>C | T/T | 0.77 | T/C | 0.22 | C/C | 0.01 |
| rs17782313 | 99 | 28 | 2 | ||||
| FABP2 | A>G | A/A | 0.56 | A/G | 0.40 | G/G | 0.04 |
| rs1799883 | 72 | 52 | 5 | ||||
| ADRB2 | G>C | G/G | 0.55 | G/C | 0.40 | C/C | 0.05 |
| rs1042714 | 71 | 51 | 7 | ||||
| SH2B1 | G>A | G/G | 0.33 | G/A | 0.51 | A/A | 0.16 |
Evaluation across fifty-nine females and seventy males showed consistent allele proportions across sexes:
Fisher's exact testing with Benjamini-Hochberg false discovery rate (FDR) adjustment confirmed no significant differences between sexes for any variant (p > 0.05), supporting combined population analyses.
Comparison with global 1000 Genomes reference data and regional Mexican cohorts revealed clear population genetic patterns:
Further investigation in genomic epidemiology, population genetics, and nutrigenomics requires robust approaches for genetic variant analysis, population stratification, and metabolic phenotyping. To support these research efforts, Protheragen provides high-throughput TaqMan SNP genotyping with customized assay design. In parallel, metabolic biomarker profiling can support the quantitative assessment of lipid profiles, glucose homeostasis markers, and relevant hormonal signals, helping researchers integrate genetic variation with metabolic phenotypes and explore potential gene–nutrition–metabolism relationships.
The findings of this population genetic study emphasize that obesity risk alleles carry population-specific frequencies shaped by historical admixture between Indigenous American and European ancestries. Recognizing the precise baseline frequencies of single nucleotide variants across the FTO, ANKK1/DRD2, MC4R, FABP2, ADRB2, and SH2B1 genes is essential for accurately calibrating polygenic risk scores, mapping metabolic biological pathways, and designing targeted nutrigenomic interventions. By demonstrating that genetic risk distribution does not significantly differ by sex in urban Mexico City, this research establishes an objective baseline to guide future large-scale genomic epidemiology studies, precision prevention frameworks, and personalized public health strategies tailored to Latin American populations.
Reference
September 16, 2026
December 9, 2025
June 22, 2026
Copyright © Protheragen. All rights reserved.