Anti-Inflammatory Effects of L-Fucose in Adipocytes A New Angle on Metabolic Balance in Obesity
October 8, 2025
December 26, 2025
The escalating global prevalence of obesity has brought metabolic complications like multi-organ insulin resistance and hepatic steatosis into sharp focus, yet we still struggle to distinguish which plasma lipid alterations are driven by excess fat alone and which are specific to metabolic dysfunction. This study, published in the Journal of Lipid Research by authors from the Washington University School of Medicine, utilizes a rigorous clinical design involving hyperinsulinemic-euglycemic clamps and MRI to evaluate the human plasma lipidome across 759 complex species and 84 eicosanoids. While past research often conflated obesity with its complications, this work addresses a critical gap by isolating "metabolically healthy" obesity from obesity accompanied by insulin resistance and fatty liver to identify true biomarkers of disease progression.
This investigation yields an exceptionally detailed, high-resolution characterization of the distinct modalities through which diverse lipid families respond to shifting metabolic status as opposed to a mere increase in total body mass. By meticulously parsing these lipidomic profiles, the researchers have delineated how individual molecular species oscillate in concentration, providing profound insights into the physiological divergence between simple adiposity and pathologically significant metabolic impairment.
The results showed that total abundances of most lipid subclasses did not differ between insulin-sensitive lean (ISL) and insulin-sensitive obese (ISO) groups, suggesting that obesity per se does not overhaul the plasma lipidome if metabolic health is preserved. However, the insulin-resistant obese with hepatic steatosis (IROS) group showed substantially higher levels of phosphatidylethanolamines (PE), triglycerides (TG), and diacylglycerols (DAG) compared to the ISO group. Specifically, 19% of subclasses were differentially abundant in IROS vs ISO, whereas 0% differed between ISO and ISL.
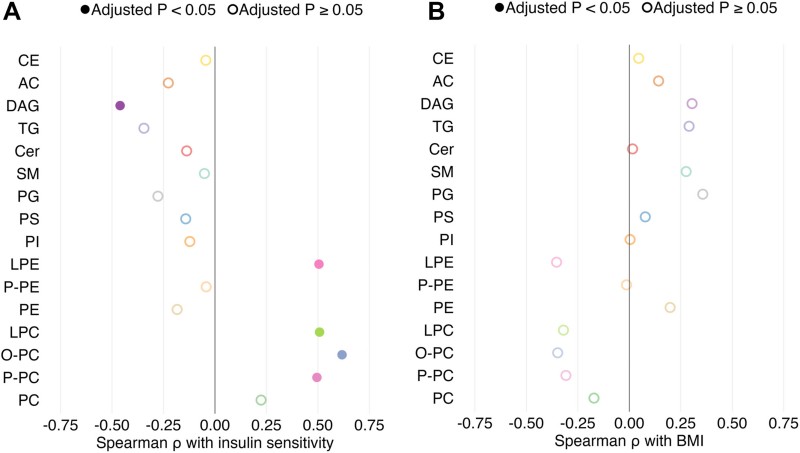 Fig.1 Complex lipid subclasses show correlations with insulin sensitivity and BMI across participants. (Petersen, et al., 2025)
Fig.2 illustrates a striking contrast: 124 individual complex lipid species (16% of measured species) were notably correlated with insulin sensitivity, whereas only 7 species (1%) correlated with BMI. Specifically, Phosphatidylcholines (P-PC and O-PC) and lysophosphatidylcholines (LPC) were positively associated with insulin sensitivity, while DAGs showed a strong negative correlation.
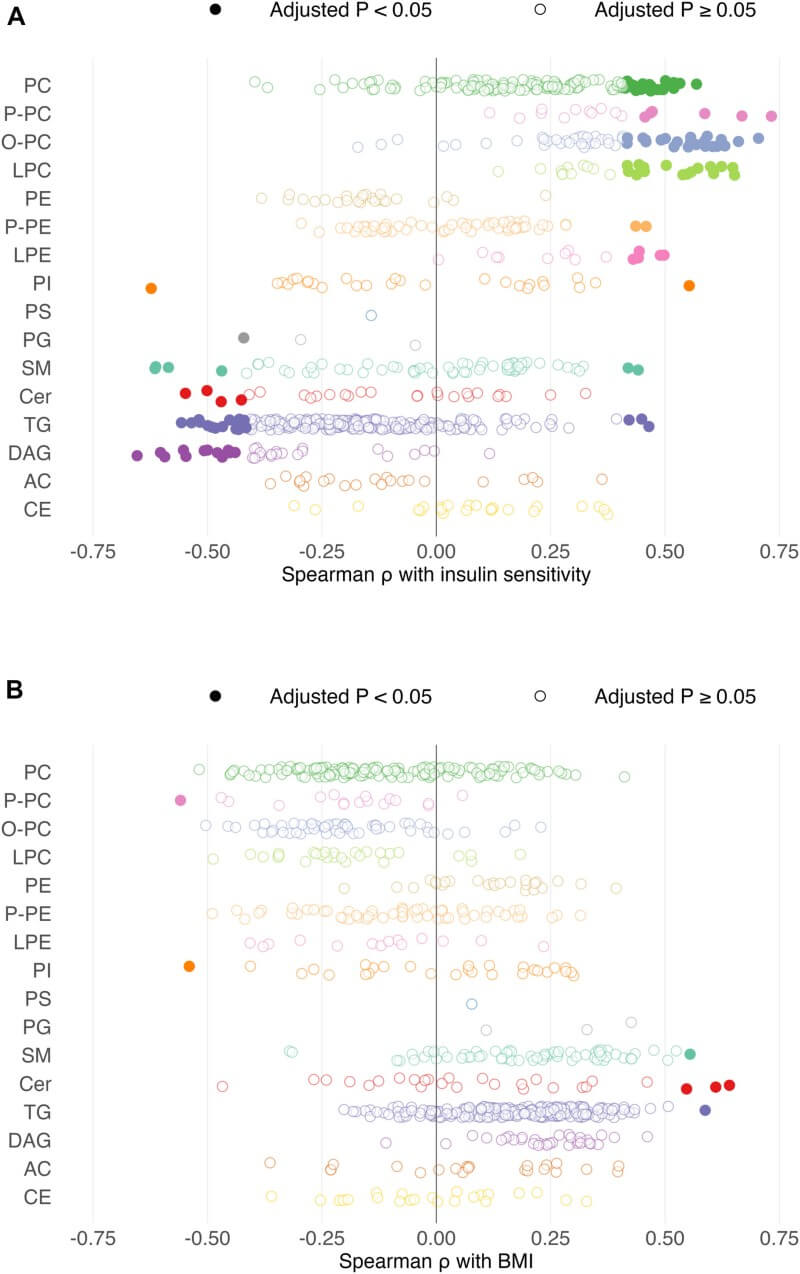 Fig.2 Individual lipid species correlate differently with insulin sensitivity and BMI, highlighting significant associations. (Petersen, et al., 2025)
As shown in Fig.3A-B, both total plasma DAGs and TGs were positively associated with intrahepatic triglyceride (IHTG) content. A greater proportion of DAG species (67.6%) than TG species (32.0%) was linked to liver fat. The study notes that plasma DAGs are temporally coupled to liver DAGs, which can activate protein kinase C-ε and inhibit insulin receptor activity. Furthermore, Fig.3C-D demonstrates that the three-lipid panel (Cer d42:0, PE 36:1, and PI 32:1) effectively discriminated the IROS group from others with a high AUC of 0.932.
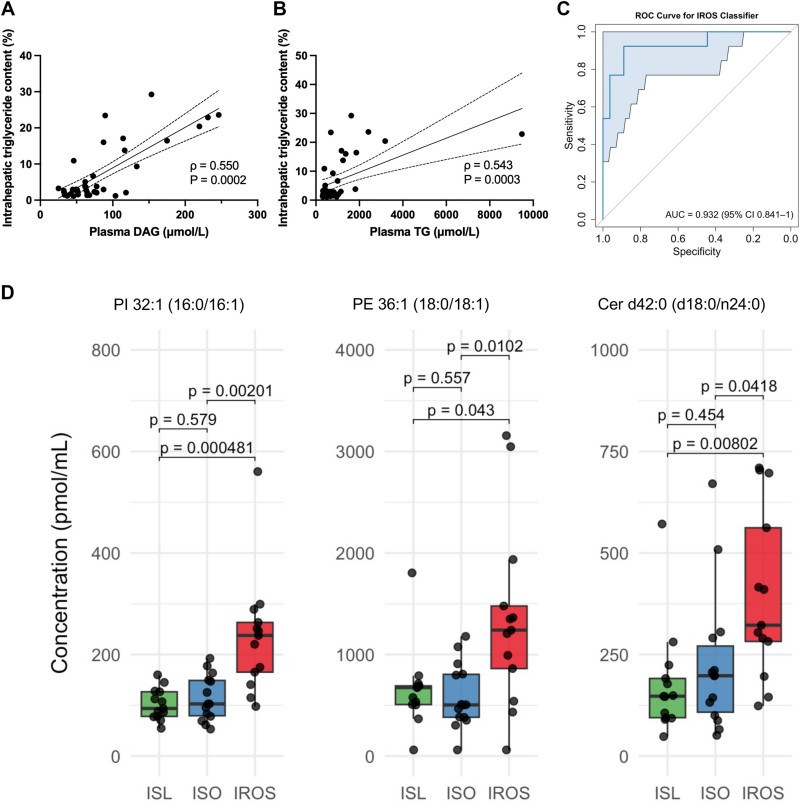 Fig.3 Plasma DAG and TG levels are associated with intrahepatic triglyceride content and can help distinguish hepatic steatosis groups. (Petersen, et al., 2025)
In a pivot from complex lipids, Fig.4 shows that plasma eicosanoids did not differ markedly between ISO and IROS groups. Instead, 13% of eicosanoids were different in ISO vs ISL, and they were higher in both obese groups compared to the lean group (Fig.4E). The eicosanoid with the greatest increase in obesity was 8-HETrE. This indicates that eicosanoid concentrations are a reflection of adiposity and its associated low-grade inflammation rather than specific insulin signaling defects.
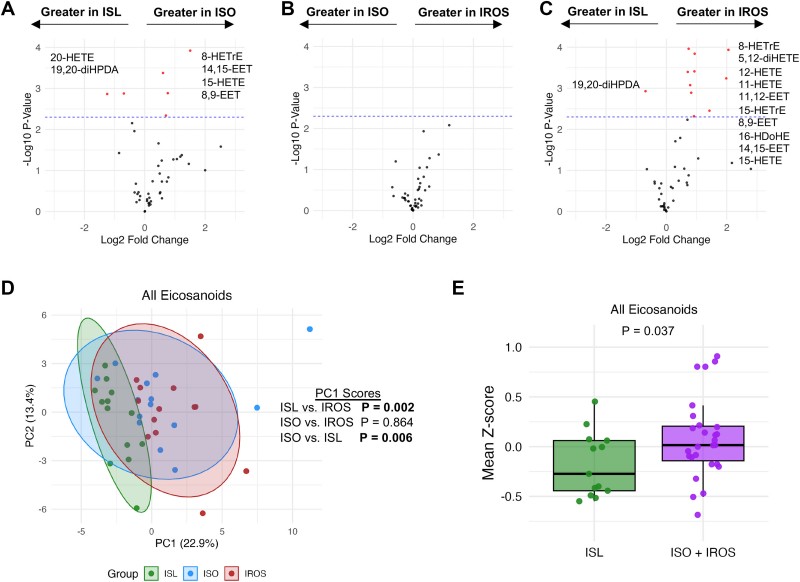 Fig.4 Plasma eicosanoid profiles vary among ISL, ISO, and IROS groups, showing distinct lipid patterns and PCA clustering. (Petersen, et al., 2025)
Beyond broad classes, the study identified precise molecular markers of metabolic health. For instance, P-PC 34:1 emerged as the most robust lipid species positively correlated with whole-body insulin sensitivity. In contrast, the analysis of plasma NEFAs revealed a different pattern: while major species like palmitate (16:0) and oleate (18:1) exhibited a downward trend in the metabolically healthy obese (ISO) group compared to the insulin-resistant (IROS) group, these fluctuations did not reach statistical significance across the cohorts. This suggests that while NEFAs are key metabolic players, specific complex lipid species like ether-linked PCs provide a more refined "fingerprint" of insulin action.
These findings shift the paradigm of metabolic research by demonstrating that the "signature" of a dysfunctional metabolism is written in complex lipids like DAGs and specific phospholipids, rather than just the amount of body fat. This suggests that plasma lipidomic profiling could serve as a powerful tool for identifying "at-risk" individuals with obesity before they develop overt type 2 diabetes. The strong correlation between plasma DAGs and IHTG content supports their use as non-invasive biomarkers for hepatic steatosis. Furthermore, the discovery that eicosanoids track with BMI while complex lipids track with insulin resistance provides a logical framework for developing targeted therapies—one set aimed at reducing systemic inflammation associated with weight, and another aimed at correcting the specific lipid-mediated pathways of insulin resistance.
For researchers dedicated to exploring lipidomics biomarkers or the mechanisms of obesity-related diseases, Protheragen provides an end-to-end lipidomics platform and multi-omics data analysis services to support your experimental design and data transformation.
Reference
Copyright © Protheragen. All rights reserves.